


But to say he looks like a shell of himself in comparison to his last three seasons might be one of the biggest understatements in the game right now.
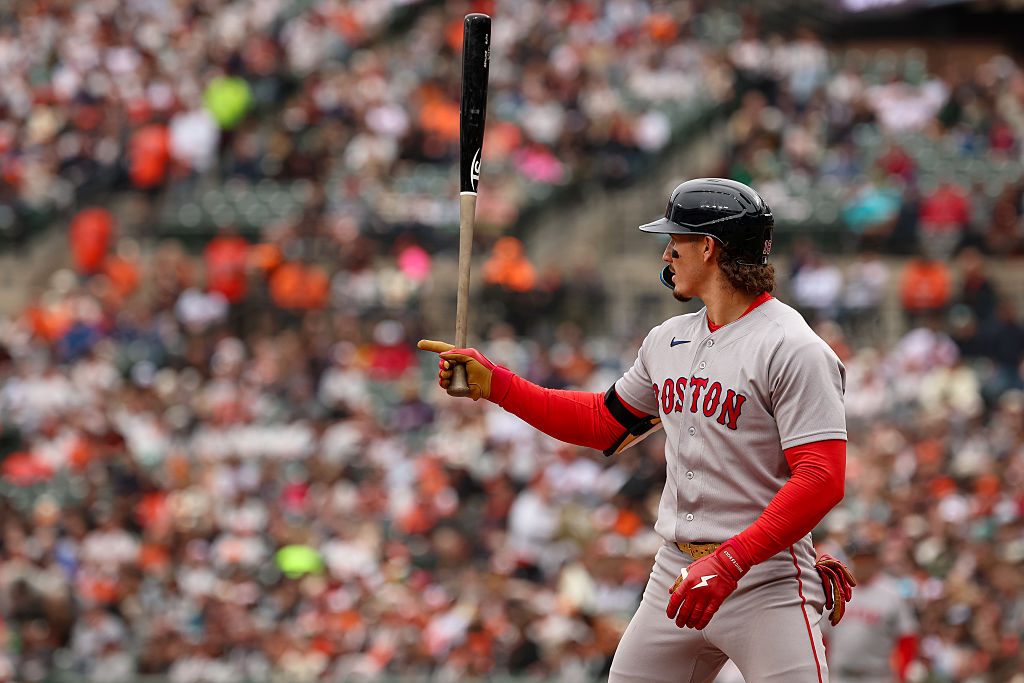
Jarren Duran looks completely lost at the plate and the Red Sox are paying for it
Duran has built himself up into a perennial well-above average hitter with a perfect blend of power and speed that gets people excited to see him at the top of a lineup card.
However, through 42 games this season, he barely looks like a serviceable starter, let alone a key cog in a top-market offense.
| Year | PA | AVG | OBP | SLG | HR | RBI | wRC+ |
| 2023 | 362 | .295 | .346 | .482 | 8 | 40 | 122 |
| 2024 | 735 | .285 | .342 | .492 | 21 | 75 | 131 |
| 2025 | 696 | .256 | .332 | .442 | 16 | 84 | 111 |
| 2026 | 182 | .181 | .247 | .301 | 4 | 19 | 50 |
Now, first-half slumps aren’t anything new for Duran as last season an 87 wRC+ in May and 91 wRC+ in June resulted in Duran only managing to muster a 103 wRC+ before the All-Star break, which was far less than 124 he posted in the second half.
However, the Red Sox would gladly take an 87 wRC+ or 91 wRC+ from their All-Star outfielder at this point in time.
His quality of contact rates are down across the board from his 2025 totals and his already skeptical plate discipline looks outright terrible to start the season.
| Stat Type | 2025 Result | 2026 Result |
| Hard-Hit % | 46.8% (71st percentile) | 40.2% (43rd percentile) |
| Barrel % | 9.7% (56th percentile) | 8.7% (55th percentile) |
| AVG Exit Velocity | 91.8 mph (87th percentile) | 89.8 mph (57th percentile) |
| K% | 24.3% (30th percentile) | 26.6% (25th percentile) |
| Whiff % | 29.3% (20th percentile) | 33.8% (9th percentile) |
| Chase % | 31.1% (30th percentile) | 37.3% (12th percentile) |
| BB% | 8.6% (53rd percentile) | 6.2% (18th percentile) |
And while his expected metrics weren’t anything to right home about in 2025, they were at least somewhat average-looking. This season though, with xBA, xSLG and xwOBA rates all falling in the 30th percentile or lower, there aren’t many names as predictably uninspiring as Duran.
| Expected Stat Type | 2025 Result | 2026 Result |
| xBA | .248 (48th percentile) | .228 (28th percentile) |
| xSLG | .410 (41st percentile) | .365 (30th percentile) |
| xwOBA | .326 (54th percentile) | .287 (19th percentile) |
To make matters worse, it’s not just Duran who’s been in the front seat of the Red Sox struggle bus this season.